PHX Perspectives | December 4th, 2018
Story Maps are for just about anyone and any organization…
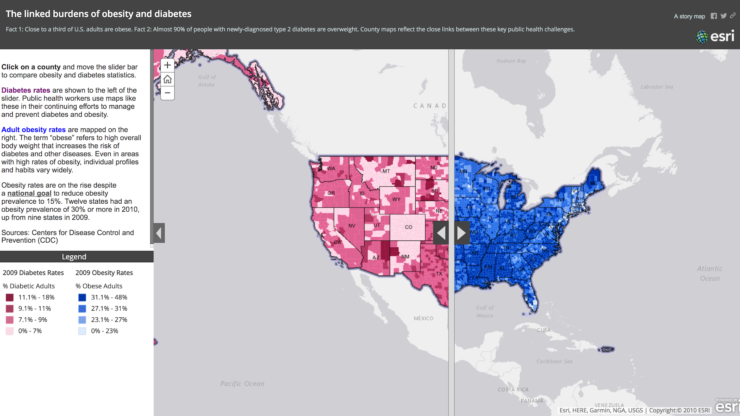
If you didn’t already know about Story Maps and their ability to combine maps (data from your organization in an Excel spreadsheet with which you can create simple maps) with text, images, and other multimedia content, the Engage and Inspire Your Audience with Story Maps program during the PHX Winter Institute in January will give you the tools to start your journey!
There are many examples of using Story Maps for organization annual reports, virtual tours, advocacy, or delivering vital public health information to your internal and external customers. You can view a large collection of examples by visiting the Story Maps Gallery. The great news is that many datasets are publicly available to you and your organization via the Living Atlas. These include maps, apps, and data layers to support your work.
Here are a few of my favorite Story Maps that showcase different ways you could use this amazing tool:
- A Health Issue: The Opioid Epidemic
- Annual Report for your organization – Rotary Club Annual Report
- Introducing staff or your company
- A new way to present a resume/CV
- Tutorials/Instructional Story Maps
- Demographics and statistics
So check it out here and we hope to see you in January!
The PHX Perspectives blog is a platform that creates an opportunity to share public health stories and viewpoints. Anyone interested in submitting a piece, which should be 600-800 words long, should contact phx@bu.edu. Population Health Exchange reserves the right to reject or edit submissions. The views expressed are solely those of the author and are not intended to represent the views of Population Health Exchange or Boston University School of Public Health.